
In our article about risk profiling, we discussed the underlying asset classes of the risk profile categories. As advisers, when assessing a person’s risk tolerance, we typically start in the middle and move up and down the risk scale based on a range of factors such as age, investment experience and time frame.
So thinking about what ‘the middle’ means, most would be comfortable if I suggested that the asset allocation was 50% growth assets (shares and property) and 50% defensive assets (cash and fixed interest). If I further suggested that this allocation be called ‘balanced’ because much like an equally-weighted set of scales, the growth/defensive split is 50/50, you may almost call this logical. This allocation seemingly gives the investor the best of both worlds; growth during strong investment markets and protection during weaker markets.
It makes sense that when a person opens a new superannuation fund and takes the ‘default’ investment option, it is often the ‘balanced’ option. Again, it sits in the middle; not too aggressive, not too conservative.
In recent times, various ratings houses have started ranking ‘balanced’ funds, creating leaderboards which have the potential to influence people when selecting a fund for their hard-earned dollars.
Our view is that comparing ‘balanced’ funds is like comparing apples and oranges. The definition that some fund managers use for ‘balanced’ is different to our ‘the middle’ definition. This doesn’t make anyone right or wrong, it just highlights that no two funds are comparable to each other.
To illustrate this, I have included a table below with the asset allocations of ‘balanced’ options from three different fund types that are currently on offer:
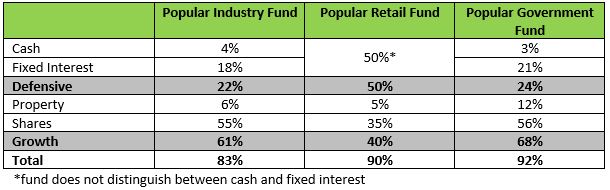
I’ve tried to keep this simple. Super funds also invest in a range of other classes such as alternatives (which may include commodities and private equity) and infrastructure. I have excluded these, which is why the totals don’t add up to 100%.
When pulling together the numbers for this table, I was surprised at the variance. The aforementioned retail fund has 50% defensive assets while the industry fund has only 22%. Yet they both call themselves ‘balanced’! Apples and oranges…
The government fund ‘balanced’ option with a 68% exposure to Property and Shares is likely to perform better than the retail ‘balanced’ options in strong investment markets, but may well underperform during weaker markets.
Further complicating all of this is that some funds will have a higher percentage of unlisted assets. These assets (those not on the stock exchange) are not regularly valued as listed investments are. Shares (as an example) are in constant state of motion, being valued minute to minute which gives rise to the ‘volatile feel’ of shares. Many fund managers invest in direct property (commercial property and the like) which may be valued annually or less. This can mean that the performance achieved by a fund invested in that asset may be miscommunicated as the figures are not updated regularly.
Risk profiling and selecting the matching appropriate investment option is only one part of the process. Drilling down into the option to understand exactly how your money will be invested is very important, and it’s what we do! Contact us today if you’d like us to take a deep dive into your super fund.